When a primer spits fire into the powder charge and burning commences, gases form, increasing pressure inside the case and (because pressure produces heat), accelerating the burn. On a graph, you’ll see a pressure peak that rises steeply after a short horizontal line reflecting the delay between primer detonation and powder ignition. Following the peak, which typically happens within a millisecond (1/1,000 second) after the powder starts to burn, the pressure curve arcs back down. This decline is relatively gradual as the bullet moves forward, increasing the volume behind it. The faster the powder, the steeper the curve on both sides. The area under this pressure/time curve translates to bullet velocity. Two to three milliseconds after the striker hits the primer, pressure has dropped to zero. The bullet is on its way.
A 180-grain bullet from a .300 Weatherby Magnum exits the muzzle of a 26-inch barrel about 1 ¼ milliseconds after it starts to move. This chart shows what happens (data adapted from a pressure/time curve in the excellent text “Any Shot You Want,” a loading manual by Art Alphin’s A-Square company):
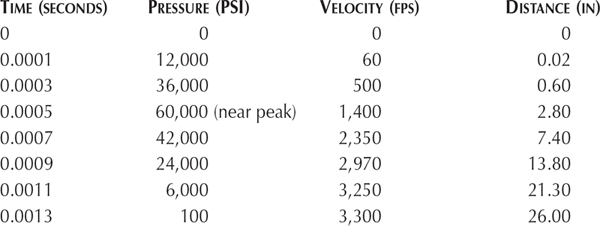
A few things to note: First, peak pressure comes when the bullet has moved only about 3 inches, even with the slow-burning fuels appropriate for a .300 magnum. The pressure drops off fast, too, losing 90 percent of its vigor in the next 18 inches of barrel. But the bullet continues to accelerate as pressure behind it diminishes. Between 14 and 21 inches, pressure loss totals 18,000 PSI. But bullet speed increases 300 fps! With very little pressure remaining behind it at the muzzle, the bullet is still accelerating! The value of a long barrel is clear, even if nearly all of it is used to control the tail of the pressure/time curve.
A pressure/distance curve differs from a pressure/time curve in slope, but it has the same general shape: steeper at the start than at the finish. The area under a pressure/distance curve represents the amount of energy available from the bullet. However, the energy generated is not all available downrange. A lot of it is lost in thermal (heat) transmission, expansion of the case into the chamber wall, bullet/rifling friction, and even bullet rotation. Plotting a load’s pressure/distance curve helps designers of gas-operated autoloading rifles because these rifles must tap the gas at some point in the bullet’s travel. Too much pressure, and the slamming can damage rifle parts. Too little, and bolt travel is insufficient to clear the fired case.
Use a bore guide when cleaning to prevent wear in chamber or throat.
Measuring gas pressure proved as difficult at first as measuring bullet velocity. Then, in the mid-1800s, Alfred Nobel and an American named Rodman came up with solutions to that problem at the same time. Rodman’s, the crusher system, is still in use. It’s a factory procedure not easily or safely performed in a home shop. A small cylindrical piston is slid into a hole in the barrel of a test gun, and a copper or lead pellet is inserted snugly between the top of the piston and a stationary anvil. When the rifle is fired, the piston pushes against the pellet or crusher, shortening it. The difference in lengths of the crusher, before and after firing, is then converted mathematically to a pressure range, in units of CUP or LUP (copper units of pressure or lead units of pressure). Copper crushers are generally either .146 in diameter and .400 long to start with, or .225 in diameter and .500 long. The choice depends on application.
Bedding can affect accuracy. Glass-bedding the action, floating a heavy barrel is popular practice.
Pounded by high pressures, crushers don’t register peak pressure accurately because the flow of the copper is slower than the change of pressure in the chamber. Also, the moving piston must be brought to a halt, which skews a reading in the opposite direction. There’s no balancing out here, just conflicting forces. Copper units of pressure and lead units of pressure are not the same; nor can they be interchanged with another common unit of pressure, pounds per square inch (PSI). CUP value may coincide with PSI value; for example, SAAMI lists 28,000 as maximum average pressure for the .45-70. Both CUP and PSI units apply. But maximum average pressure for the .243 is 52,000 CUP and 60,000 PSI. Most cartridges show similar discrepancies. Sadly, there’s no easy way to convert CUP to PSI or vice versa.
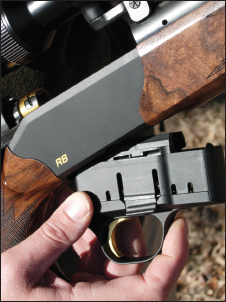
Like its R93 predecessor, the Blaser R8 has a straight-feed magazine. But the R8’s is removable.
A more modern device for pressure measurement in firearms is the piezoelectric gauge. It registers an electric charge delivered through a transducer when a crystal is crushed. Pressure applied to the crystal yields a proportional transducer reading in pounds per square inch. Conformal transducers are installed in the barrel, just like crusher pistons, and become part of the barrel. External transducers can be mounted on the barrel, then removed for replacement or calibration checks.
Another pressure tester that’s become popular among shooters is the strain gauge. Developed for the consumer market by chronograph guru Ken Oehler, it’s essentially a piece of wire that you glue to the outside of your chamber wall. When you fire the rifle, the chamber expands and the wire stretches. Wire length is then compared with a previous measure to get a stretch reading that translates into pressure. These readings do not equate with readings from a crusher or piezoelectric gauge. The way to use a strain gauge is to read pressures from factory loads and maximum recommended loads and determine relative pressures of hunting loads by comparing values.
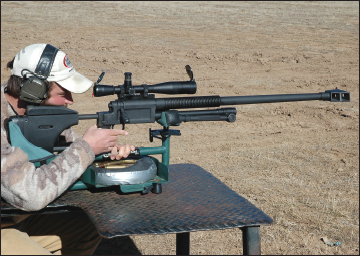
Phil Quick tries out a 50-caliber rifle. A brake tames recoil; the concussion is still formidable.